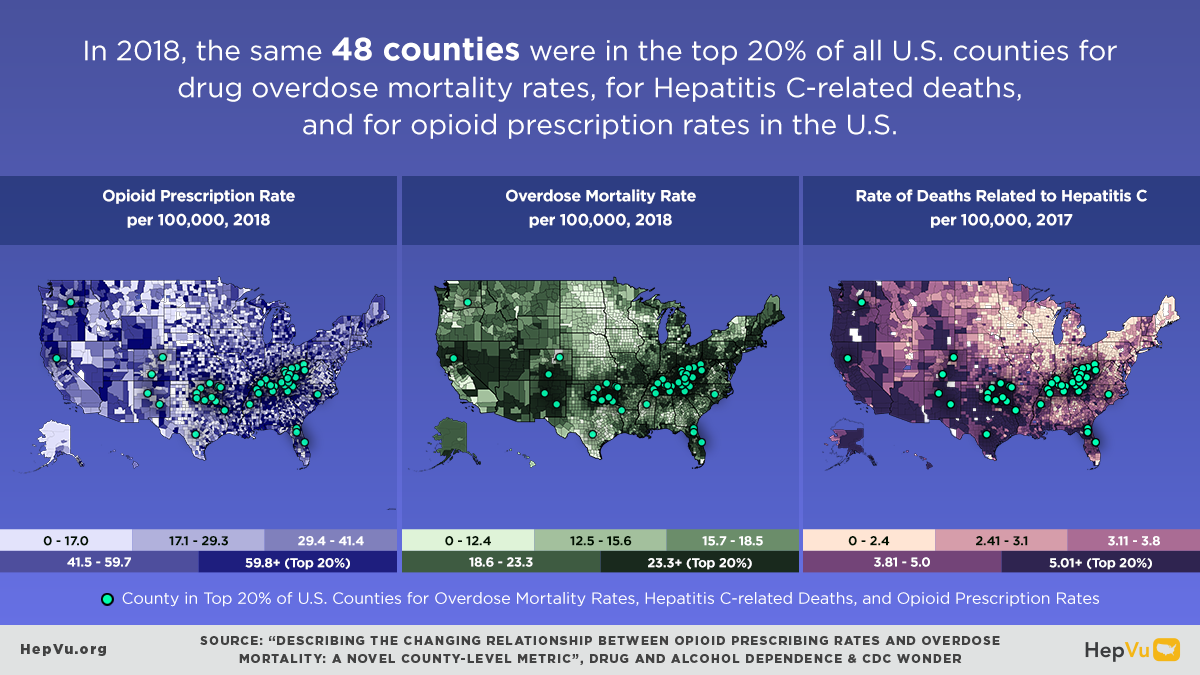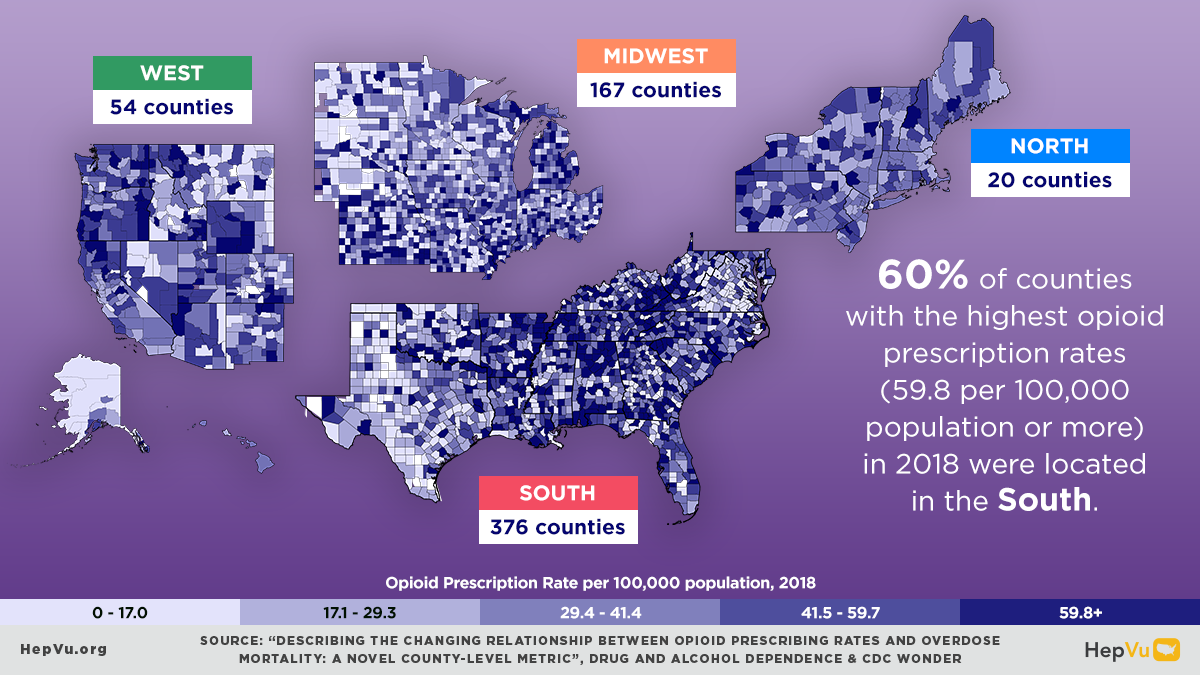
Today, HepVu added county-level opioid prescription and overdose mortality rates data and maps to visualize the relationship between opioid prescription practices and drug overdose mortality and illustrate how the differences among geographic regions can affect health outcomes. These maps visualize 2018 county-level opioid prescription and overdose mortality rates from 2014 to 2018 across the U.S.
In 2018, the same 48 counties were in the top 20% of all U.S. counties for drug overdose mortality rates, Hepatitis C-related deaths, and opioid prescription rates in the U.S. Despite a decline in drug overdose deaths from 2017 to 2018, the Centers for Disease Control and Prevention (CDC) reported a 29% increase in drug overdose deaths from 2019 to 2020. This preliminary data from CDC shows an estimated 93,331 deaths, including a reported 68,821 opioid-related deaths.
“This novel look at the relationship between opioid prescriptions and overdose mortality highlights the potential impact of location and social determinants of health on the opioid epidemic and injection behaviors across the U.S.,” said Heather Bradley, PhD, Associate Professor of Epidemiology at Georgia State University’s School of Public Health and Project Director for HepVu. “Our goal is to help identify areas experiencing an increase in injection drug use and inform policies and programs working to address substance use and prevent a subsequent increase in Hepatitis C transmission.”
HepVu’s county-level opioid prescription and overdose mortality rates data were published in a study published in Drug and Alcohol Dependence.
County-Level Opioid Prescription and Overdose Mortality on HepVu
The county-level opioid prescription and overdose mortality data on HepVu provides an overview of the relationship between opioid prescribing practices and overdose mortality rates in the U.S. Since 2012, the national rate of opioid prescriptions has decreased, but the number of overdose deaths per 100,000 opioid prescriptions has increased – indicating a shift from prescription opioids to illicit opioids and other drugs.
Opioid prescriptions and overdose mortality data can be used to:
- Monitor progress, trends, and disparities in opioid prescriptions and overdose mortality at the county-level among specific age groups and compare side-by-side with maps of social determinants of health visualizing poverty, high school education, and median household income;
- Compare opioid prescription and overdose mortality rate among counties in your state or region;
- Support research to identify areas that experience an increase in injection drug use and subsequent increases in Hepatitis C transmission;
- Inform advocacy to improve the health of people who use drugs; and
- Inform public health planning.
For more information on the data source and limitations, see our Data Methods and FAQs.
To learn more about county-level opioid prescription and overdose mortality data, explore HepVu’s resources:
- View interactive opioid prescription and overdose mortality maps at the county-level and stratify by age.
- Download opioid prescription and overdose mortality data at the county-level on HepVu for your own research and analysis.
- Read the expert-led blog to deepen your understanding of the relationship among opioid prescription, overdose mortality, and Hepatitis C.


