As 2022 draws to a close, we here at HepVu would like to thank all our advisors, partners, and members of our community that make this project possible. Thank you to our Advisory Committee and Viral Hepatitis Surveillance Status Report Steering Committee for their persistent guidance, to the organizations like NASTAD and NVHR that partner with us, and to the researchers who help us develop these data. In particular we would like to thank our users—whether in academia, in policy, or people with lived experience—for their continued support. We are excited to head into 2023!
Viral Hepatitis Surveillance Status Report
HepVu and NASTAD released the first-ever assessment of viral hepatitis surveillance practices across U.S. jurisdictions, showing that while public health professionals are doing commendable surveillance work with currently available resources, there is a need for additional funding and resources. In 2021, one-third of U.S. jurisdictions did not have a full-time employee dedicated to viral hepatitis surveillance, even though staff and dedicated time are needed to perform basic surveillance activities. Meanwhile, only half (55%) of jurisdictions were able to produce annual surveillance summaries in 2021, which are important for informing programmatic planning and resource allocation.
This inaugural viral hepatitis surveillance status report benchmarks the state of viral hepatitis surveillance in the U.S. prior to funding dissemination, establishes a baseline to monitor changes over time as federal resources are allocated, assesses how jurisdictions across the U.S. are measuring the impact of viral hepatitis on their communities, and highlights areas in need of additional resources.
State-level Opioid Maps and Data:
HepVu added updated state-level opioid prescription, pain reliever misuse, and overdose mortality data and maps to visualize the relationship between the opioid and viral hepatitis epidemics, as well as illustrate how differences among geographic regions can affect health outcomes. These maps visualize 2020 opioid prescription rates, 2018-2019 pain reliever misuse percent, and 2020 overdose mortality rates across the U.S.
County-level Opioid Maps and Data
HepVu also added updated data and maps on pain reliever misuse and overdose mortality at the county level. These county-level maps visualize 2020 opioid prescription rates per 100 people and 2020 overdose mortality rates per 100,000 people across the U.S.
Opioid data profiles and maps on HepVu can be used to:
- Monitor progress, trends, and disparities in opioid prescriptions, pain reliever misuse, and overdose mortality and compare side-by-side with maps of social determinants of health visualizing poverty, high school education, and median household income;
- Compare opioid data among states and counties in your region, as well as viral hepatitis data such as prevalence and mortality;
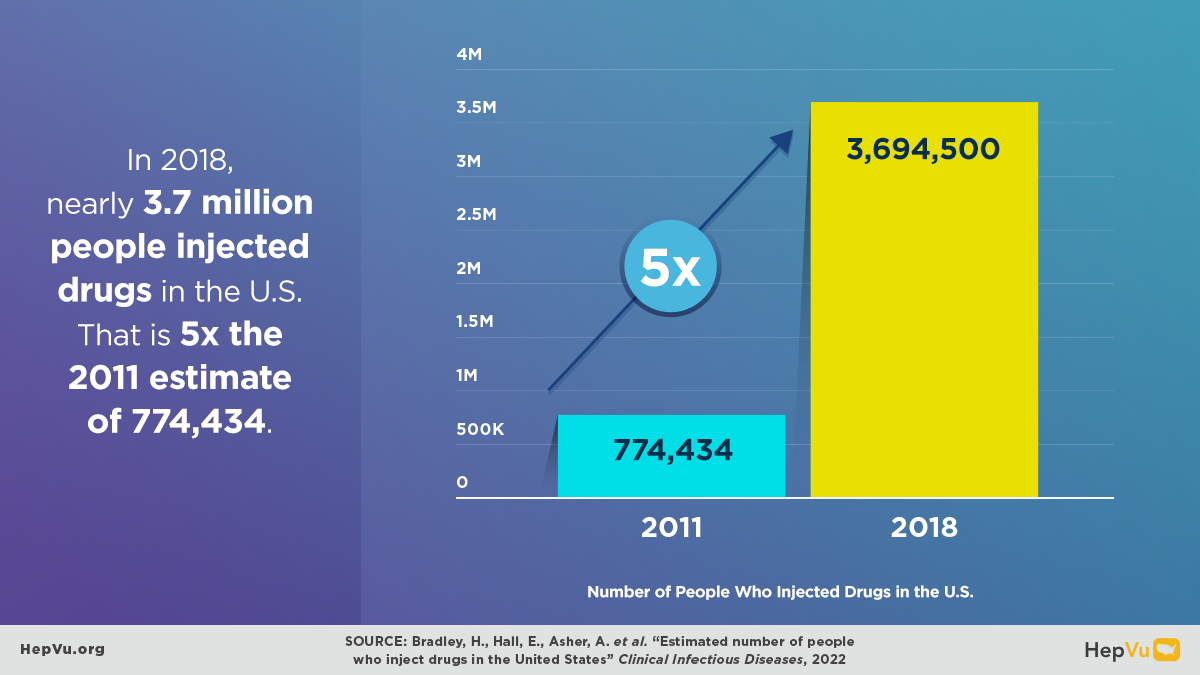
- Support research to identify areas that experience an increase in injection drug use and subsequent increases in Hepatitis C transmission;
- Inform advocacy to improve the health of people who use drugs; and
- Inform public health planning.
Hepatitis C Treatment Restrictions Data
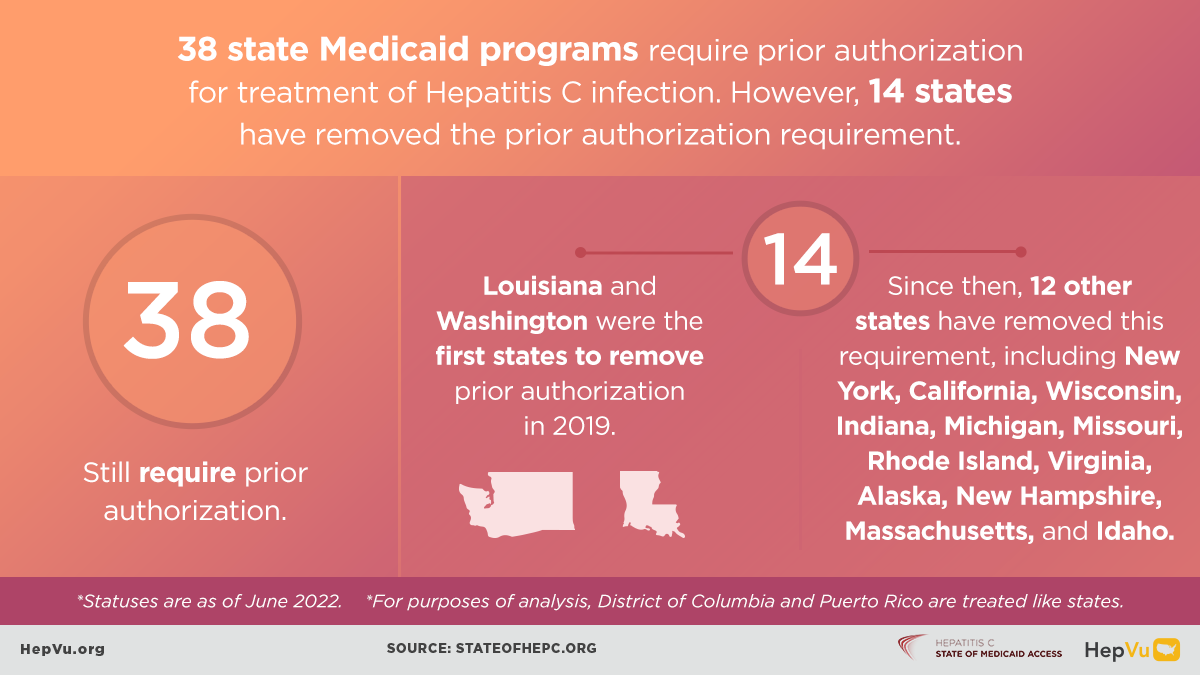
HepVu added updated data and comparison maps visualizing Hepatitis C treatment restrictions at the state-level from 2017 to 2022, utilizing insights and research findings provided by the Center for Health Law and Policy Innovation (CHLPI) of Harvard Law School and the National Viral Hepatitis Roundtable (NVHR). HepVu also released a new map visualizing the restrictions around prior authorizations, in addition to updated state profiles that show each state Medicaid program’s Hepatitis C treatment restrictions. These new data and visualizations document the changing Hepatitis C treatment restrictions landscape.
The U.S. has made tremendous progress in eliminating or scaling back these treatment restrictions since tracking began in 2017. Due to the continued and diligent work of viral hepatitis organizations such as CHLPI and NVHR many states have eliminated or loosened restrictions.

