Today, HepVu added county-level Hepatitis C-related mortality data and maps to identify key disparities and illustrate the extent to which factors such as age and geographic region affect health outcomes. These maps visualize county-level Hepatitis C-related mortality from 2005 to 2017 across the U.S.
Hepatitis C-related mortality data on HepVu is defined as deaths attributable to the Hepatitis C virus. The Centers for Disease Control and Prevention (CDC) has estimated that despite the existence of a curative treatment, there were over 15,000 Hepatitis C-related deaths in 2018. In the U.S., it is estimated that 40% of those living with chronic Hepatitis C are unaware of their infection.
HepVu’s county-level Hepatitis C-related mortality data were originally calculated in a study published in Hepatology.
County-Level Hepatitis C-Related Mortality on HepVu
The county-level Hepatitis C-related mortality data on HepVu provide a granular view of Hepatitis C-related mortality trends across the country. Although these results do not replace the need for a comprehensive and cohesive viral hepatitis surveillance system, this first-ever look at Hepatitis C-related mortality at the local-level provide an important metric for understanding the evolution of the Hepatitis C epidemic.
Hepatitis C-related mortality data can be used to:
- Monitor progress, trends, and disparities in Hepatitis C-related mortality at the county-level among specific age groups, and by race and sex at the state-level;
- Compare Hepatitis C-related mortality among counties in your state or region;
- Support research to identify viral hepatitis interventions and preventions; and
- Inform public health planning.
For more information on the data source and limitations, see our Data Methods and FAQs.
Key Insights from the Data
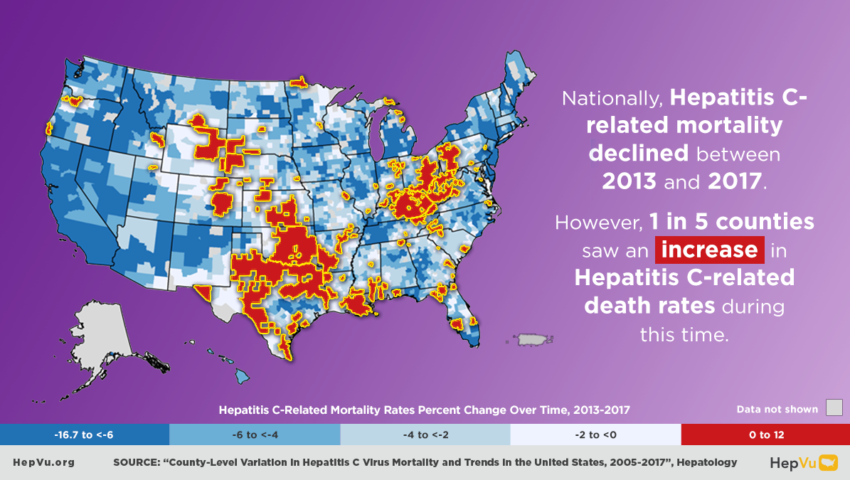
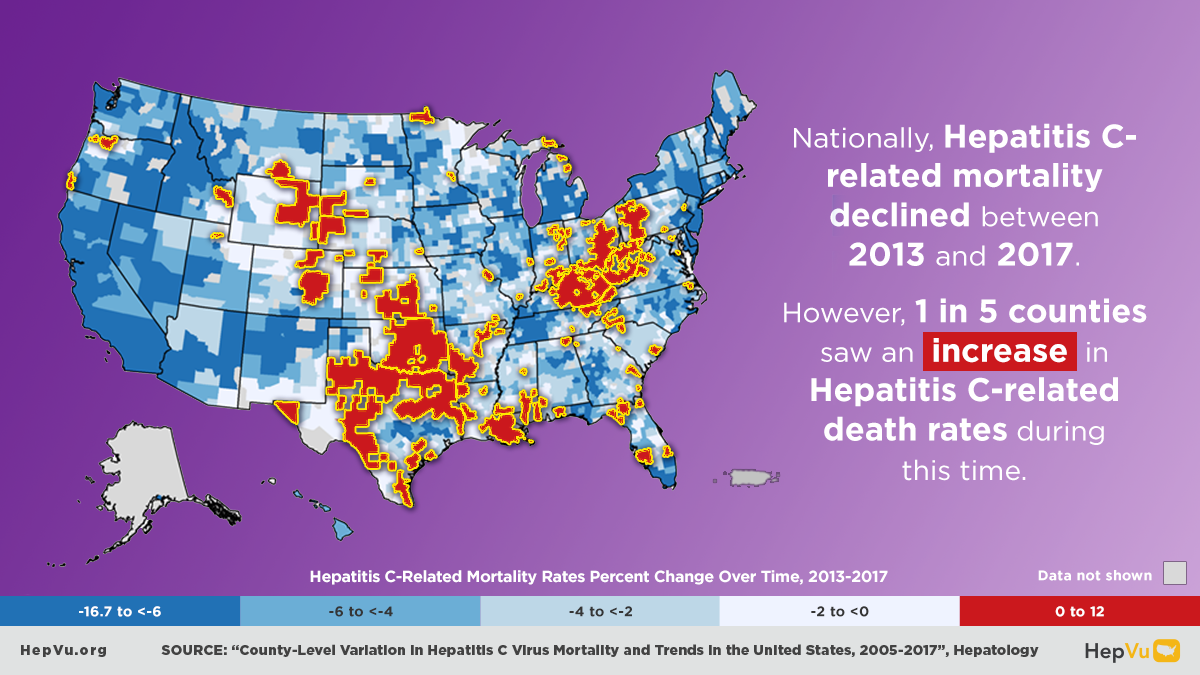
Hepatitis C-related mortality has decreased nationwide from 5.2 deaths per 100,000 in 2013 to 4.34 deaths per 100,000 in 2017.
- Approximately 1 out of 5 counties in the analysis showed an increase in Hepatitis C-related mortality rates between 2013 and 2017.
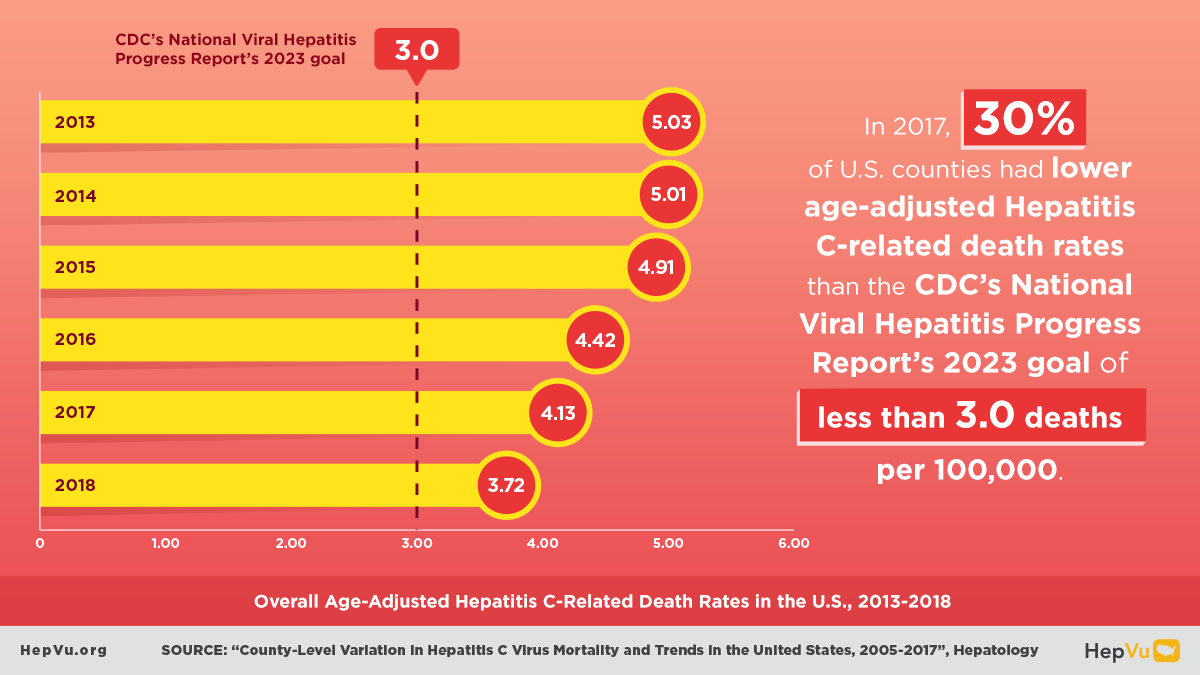
- In 2017, 30% of U.S. counties had a lower age-adjusted Hepatitis C-related death rate than the National Viral Hepatitis Progress Report’s 2023 goal of less than 3.00 deaths per 100,000 population.
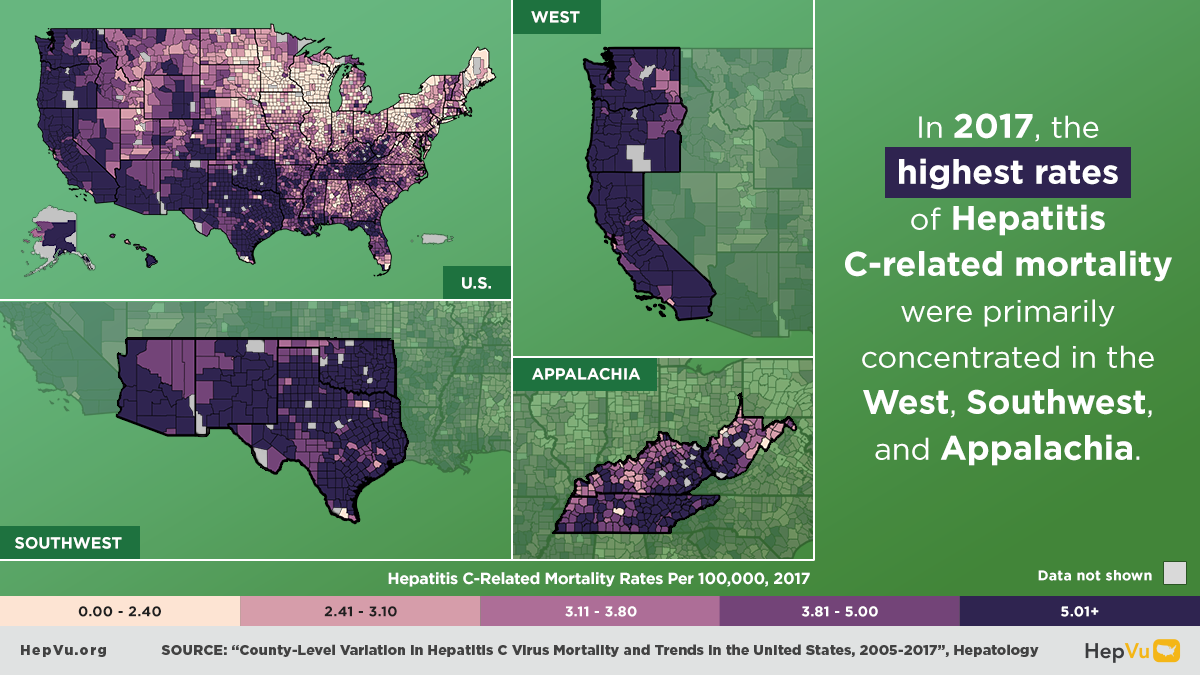
- In 2017, the highest rates of Hepatitis C-related mortality were primarily concentrated in the West, Southwest, Appalachia, and northern Florida.
In the U.S., a large majority of chronic Hepatitis C infections are among “Baby Boomers,” who are adults born between 1945 and 1965. As people in this group age and pass away, their Hepatitis C-related death rates are expected to decrease.
- The bulk of Hepatitis C-related mortality are among adults older than 40 years of age, occurring along the West Coast and in the Southwest.
- The curative treatments, direct-acting antivirals (DAAs), introduced in 2011 would also be expected to decrease the Hepatitis C-related mortality rates as people are cured.
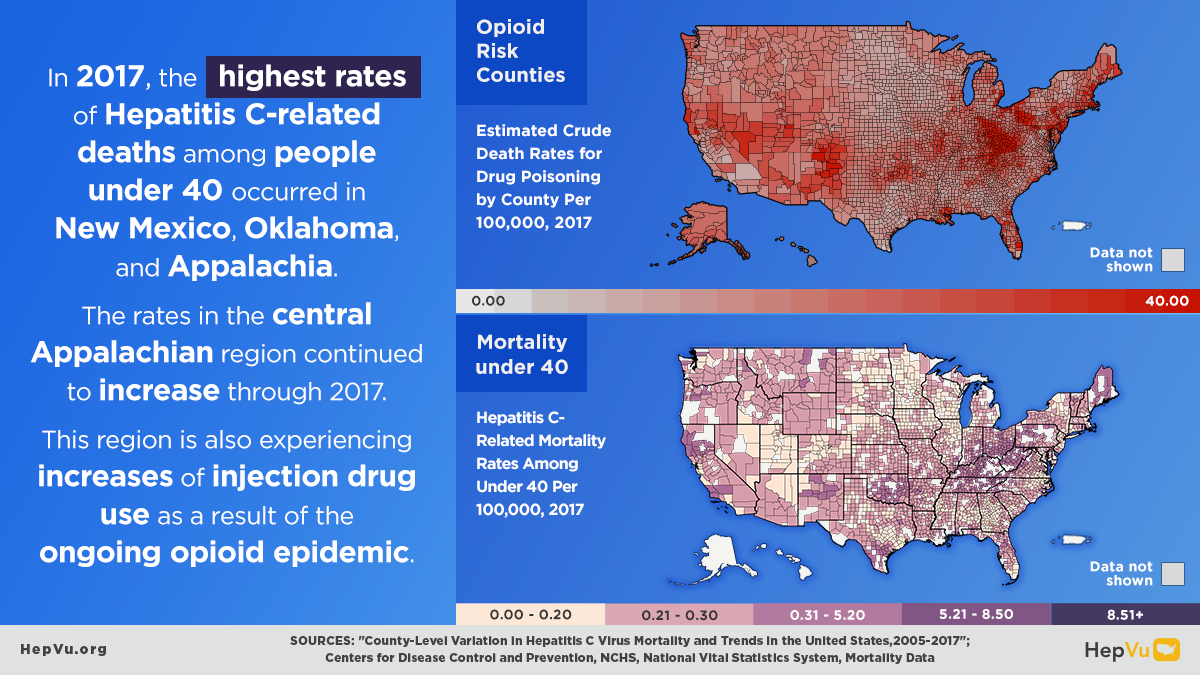
However, Hepatitis C-related mortality is increasing among adults younger than 40 years of age in various regions across the country.
- The highest rates of Hepatitis C-related mortality among people under 40 occurred in New Mexico, Oklahoma, and Appalachia.
- The Hepatitis C-related mortality rates in the central Appalachian region continued to increase through 2017. These regions have also experienced increases in injection drug use as a result of the ongoing opioid epidemic.
Share our Infographics

To learn more about county-level Hepatitis C-related mortality data, explore HepVu’s resources:
- View interactive Hepatitis C-related mortality maps at the county-level and stratify by age.
- Download Hepatitis C-related mortality data at the county-level on HepVu for your own research and analysis.
- Read expert-led blogs to deepen your understanding of Hepatitis C-related mortality trends and its causes.
- HepVu Q&A: Dr. Eric Hall on County-Level Hepatitis C-Related Mortality Trends in the U.S.