• Skip to primary navigation
  • Skip to main content
  • Skip to footer

HepVu

HepVu

An estimated 3.5 million people in the U.S. are living with chronic Hepatitis C infection.

  • View the Map
  • Local Data
  • Find Services
  • News & Updates
  • Events
  • Tools & Resources
Home News & Updates Hepatitis B Infographics

Hepatitis B Infographics

May 4, 2017

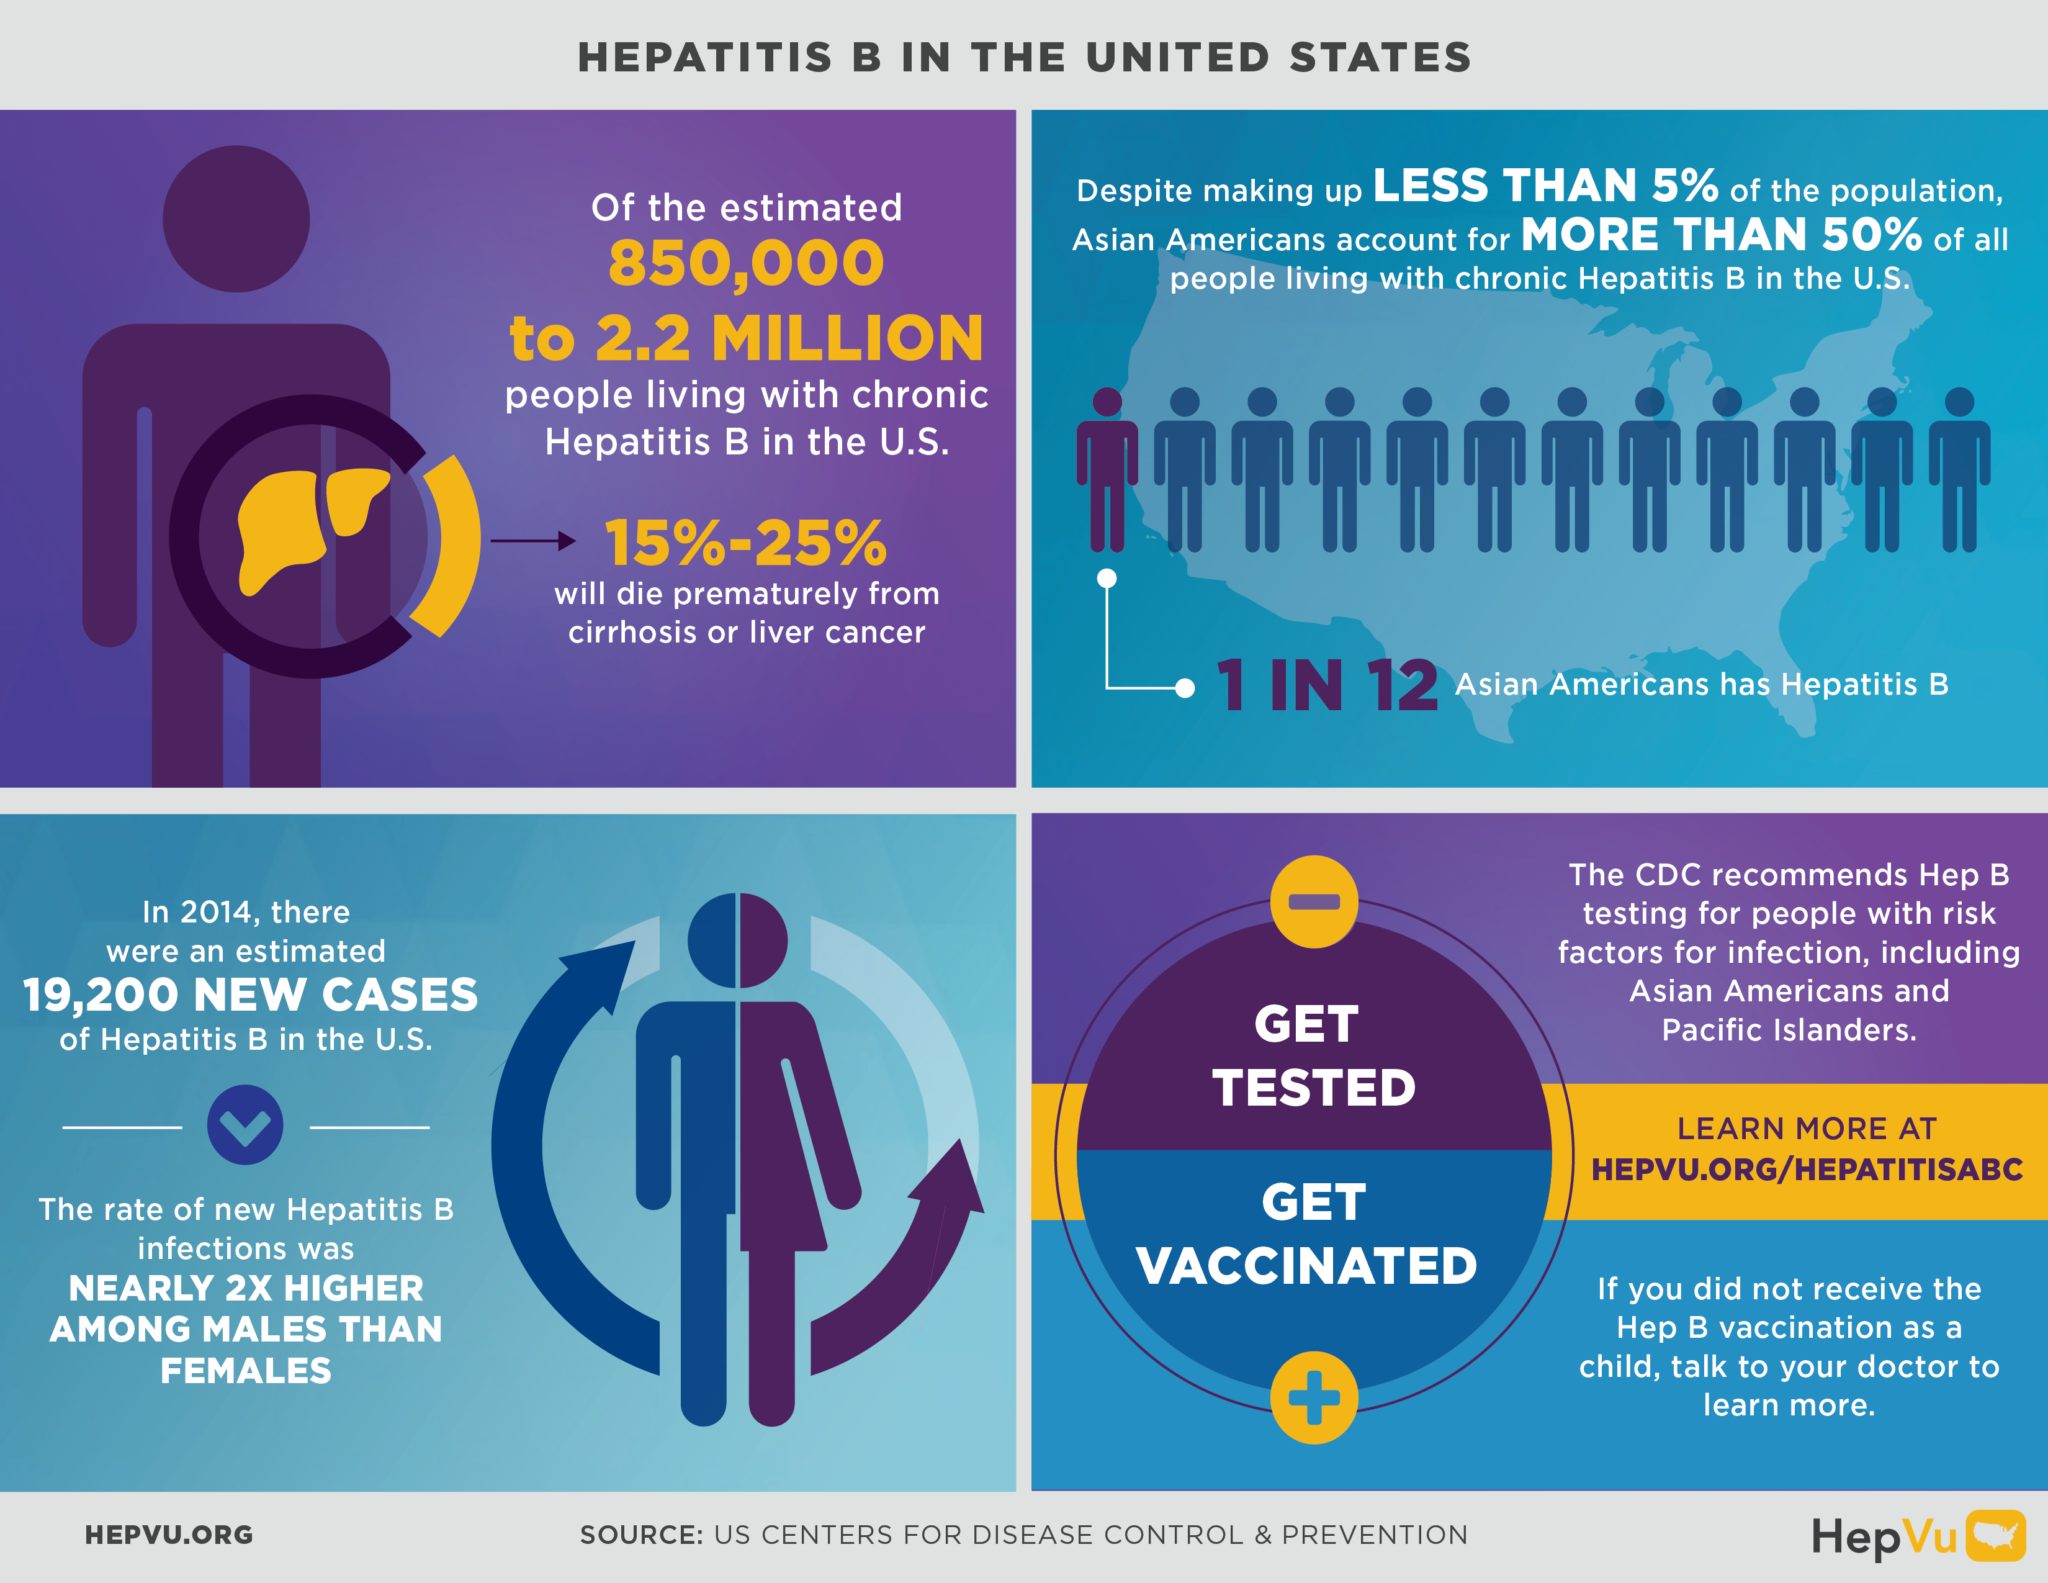
The CDC estimates that between 850,000 and 2.2 million people have chronic HBV in the U.S., and approximately 19,200 new HBV infections occur each year. Share our infographics below to help your community stay informed about Hepatitis B.

Most Read

Hepatitis C Treatment Restrictions
Combatting Hepatitis C Among People Who Use Drugs in Appalachia
What’s New in Viral Hepatitis – February
Share Facebook Twitter LinkedIn Email

Keep Reading

February 2, 2023

HepVu Welcomes New HepVu Technical Advisory Group

Read More

February 2, 2023

What's New in Viral Hepatitis - February 2023

Read More

December 14, 2022

2022: A Year in Review

Read More

December 12, 2022

HepVu Adds 2020 County-Level Opioid Maps and Data

Read More

Sign up for HepVu updates.

Footer

AIDSVu HepVu

HepVu is presented by Emory University’s Rollins School of Public Health in partnership with Gilead Sciences, Inc.

  • About
  • FAQ
  • Data Methods
  • Datasets

Questions?
Info@HepVu.org

Media Inquiries
(202) 854-0480
Media@HepVu.org

Follow Us

  • Facebook
  • Twitter

© 2023 HepVu. All Rights Reserved.

  • Privacy Policy
  • Contact Us

Get HepVu in Your Inbox

Sign up to stay informed on new data, maps, expert Q&As, and infographics about Hepatitis C and opioids where you live.