• Skip to primary navigation
  • Skip to main content
  • Skip to footer

HepVu

HepVu

An estimated 3.5 million people in the U.S. are living with chronic Hepatitis C infection.

  • INTERACTIVE MAP
  • Location Profiles
  • Find Services
  • News & Updates
  • Events
  • Tools & Resources
Home Infographics Page 4

Infographics

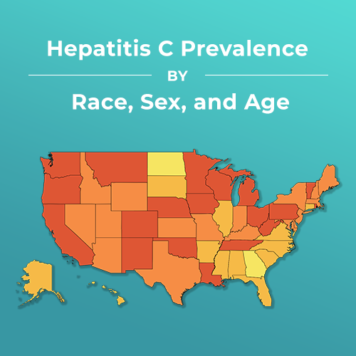
January 14, 2020

HepVu Launches New Data Visualizing Hepatitis C’s Impact on Americans of Different Ages, Sexes, and Races

December 12, 2019

A Year in Review: HepVu’s 2019 Highlights

Read More

May 14, 2019

Hepatitis Testing Day 2019

Read More

January 14, 2019

HepVu Releases State-Level Maps Showing Impact of Hepatitis C Epidemic Across the U.S.

Read More

May 18, 2018

Hepatitis Testing Day

Read More

May 4, 2017

Hepatitis B Infographics

Read More

May 4, 2017

Hepatitis C Infographics

Read More
  • Go to page 1
  • Go to page 2
  • Go to page 3
  • Go to page 4

Sign up for HepVu updates.

Footer

AIDSVu HepVu

HepVu is presented by Emory University’s Rollins School of Public Health in partnership with Gilead Sciences, Inc.

  • About
  • FAQ
  • Data Methods
  • Datasets

Questions?
Info@HepVu.org

Media Inquiries
(202) 854-0480
Media@HepVu.org

Follow Us

  • Facebook
  • Twitter

© 2025 HepVu. All Rights Reserved.

  • Privacy Policy
  • Contact Us

Get HepVu in Your Inbox

Sign up to stay informed on new data, maps, expert Q&As, and infographics about Hepatitis C and opioids where you live.